Via 19.1 is available
We are happy to announce the immediate availability of Via 19.1, the newest version so far.
New and improved functionality
For this version, we focused on Network, Attributes-support and Performance Optimizations, which is where you’ll find the greatest changes:
Network:
- Support for detailed link geometries. We are very excited about this often-requested
feature to support visualizations, where links in the network are not just straight lines,
but can actually have curves or arbitrary polylines as geometry. This feature is enabled
by providing a list of intermediary coordinates for each link.
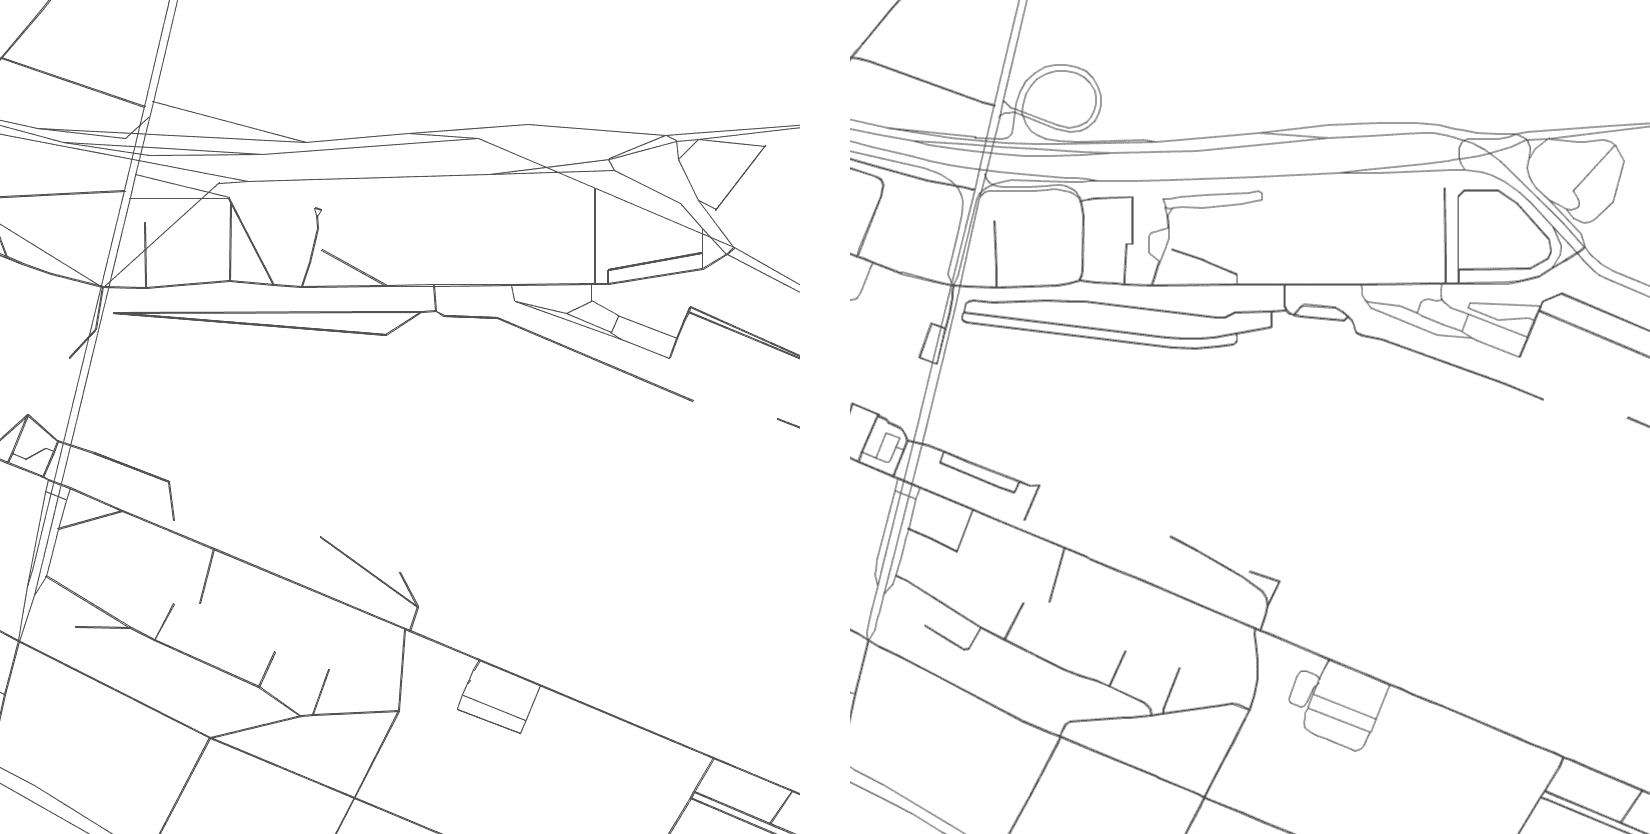
Network with straight links (left) and with detailed link geometry (right)
- Support for Node- and Link-Attributes from MATSim’s network_v2 file format.
- Calculate free-speed travel-times starting at nodes in the network
- Calculate the shortest paths to other nodes starting at a node in the network.
- Use Node-attributes when visualizing links

Combined visualization of travel times and shortest paths in a large network.
Attributes:
Several data formats in MATSim were recently extended to support “internal” attributes. Via now supports such attributes for Facilities and Node- and Link-Attributes from the network. In addition, the Shapes layer now also supports loading additional attributes, e.g. from CSV files, and match them to shapes or zones.
Performance Optimizations:
- We have reworked the internal data structures used to visualize vehicle trajectories and were able to reduce the memory consumption by up to 40%, allowing you to visualize even larger scenarios.
- We have massively improved the performance of the Aggregation and OD-Aggregation analysis. Aggregating large data sets is now noticeably faster, especially when aggregating into Shapes. And to top it all, the OD-Aggregation even uses less memory now, allowing you to work with even larger data sets.
- Along with the optimization of the Aggregation analysis, we also generally improved the handling of very large data sets. As an example, XY plotter is now able to work with data sets containing 100 million data points or more.
- Saving data in *.via-files is now faster and produces smaller files.
There were other, smaller performance and memory improvements in other places, and some UI fixes and bug fixes as well, resulting in the hopefully best version of Via yet.
We will publish additional news entries in the coming days and weeks, where we’ll highlight some of the aforementioned features in more detail.
Download the newest version
Go to the Download section to get the latest version of Via!
Why version 19.1?
You might have noticed that we jumped from version 1.8.3 straight to 19.1. The reason for this is simple: in the past, we often had around 1 major update every year for Via, and increased the version number accordingly. But starting last year, we published multiple updates to Via, each bringing new functionality with it. And we plan to even top it this year, by bringing you more often new functionality and improvements. In such a situation, a version number based on major/minor updates does not make sense. Instead we opted to enumerate the number of releases along with the current year: Version 19.1 stands thus for the 1st release in 2019.